∮ Speed of Sound in The Ocean
MacKenzie Equation
The speed of sound $C$ in the ocean is primarily a function of pressure $P$ (sometimes represented as depth $Z$), temperature $T$, and salinity $S$. A simple formula to find the speed of sound in the ocean for a certain set of conditions is the MacKenzie equation (1981): \begin{multline} C = 1448.96 + 4.591T - 0.05304T^2 + 0.0002374T^3 + 0.0160Z + \\ (1.340-0.01025T)(S-35) + 1.675\times10^{-7}Z^2 - 7.139\times10^{-13}TZ^3 \end{multline} Temperature is measured in degrees Celcius; salinity is measured in parts per thousand; depth is measured in meters. Notice that it seems like temperature is the primary factor in this model -- only 2 terms (if you multiply the two binomials out) have a linear salinity dependence, while the coefficients of the terms that depend on depth to the second and third order are quite small in comparison to the coefficients of the $T^2$ and $T^3$ terms. In fact, the first task I set myself was to plot this equation while holding salinity and temperature constant, only varying the depth. Before showing you the results of this, let me introduce a few other equations that might be used in predicting the speed of sound in the ocean.The range of validity of the MacKenzie equation is from
$2°\text{C}\leq T\leq 30°\text{C}$;
$25\text{ppt}\leq S\leq 40\text{ppt}$;
$0\text{m}\leq Z\leq 8000\text{m}$
Coppens Equation
Coppens equation is another fairly simple equation to use; it has some different unit conventions though. In this model, $t=T/10$ where $T$ is the temperature in Celcius; and the depth is in kilometers instead of meters (of course one could update the coefficients in order to make use of the more typical units). \begin{multline} C = C_0 + (16.23 + 0.253t)Z + (0.213-0.1t)Z^2 +\\ [0.016 + 0.0002(S-35)](S-35)tZ \end{multline} where \begin{multline*} C_0 = 1449.05 + 45.7t - 5.21t^2 + 0.23t^3 + (1.333-0.126t + 0.009t^2)(S-35) \end{multline*} The range of validity of the Coppens equation is from$0°\text{C}\leq T\leq 35°\text{C}$;
$0\text{ppt}\leq S\leq 45\text{ppt}$;
$0\text{m}\leq Z\leq 4000\text{m}$
UNESCO Equation
The UNESCO equation (also known as the international standard algorithm) is much more involved than the MacKenzie and Coppens equations. Instead of using depth as a variable, it used pressure $P$ in bar -- note that temperature in this equation is back to being good 'ol degrees Celcius. \begin{equation} C = C_w(T,P) + A(T,P)S + B(T,P)S^{\frac{3}{2}} + D(P)S^2 \end{equation} where \begin{multline*} C_w(T,P) = \left(C_{00} + C_{01}T + C_{02}T^2 + C_{03}T^3 + C_{04}T^4 + C_{05}T^5\right)+\\ \left(C_{10} + C_{11}T + C_{12}T^2 + C_{13}T^3 + C_{14}T^4 \right)P+\\ \left(C_{20} + C_{21}T + C_{22}T^2 + C_{23}T^3 + C_{24}T^4 \right)P^2+\\ \left(C_{30} + C_{31}T + C_{32}T^2 \right)P^3 \end{multline*} \begin{multline*} A(T,P) = \left(A_{00} + A_{01}T + A_{02}T^2 + A_{03}T^3 + A_{04}T^4\right)+\\ \left(A_{10} + A_{11}T + A_{12}T^2 + A_{13}T^3 + C_{14}T^4 \right)P+\\ \left(A_{20} + A_{21}T + A_{22}T^2 + A_{23}T^3 \right)P^2+\\ \left(A_{30} + A_{31}T + A_{32}T^2 \right)P^3 \end{multline*} \begin{multline*} B(T,P) = B_{00} + B_{01}T + (B_{10} + B_{11}T)P \end{multline*} \begin{multline*} D(P) = D_{00} + D_{10}P \end{multline*}| $C_{00}$ | $1402.388$ | $C_{01}$ | $5.03830$ |
|---|---|---|---|
| $C_{02}$ | $-5.81090\times10^{-2}$ | $C_{03}$ | $3.3432\times10^{-4}$ |
| $C_{04}$ | $-1.47797\times10^{-6}$ | $C_{05}$ | $3.1419\times10^{-9}$ |
| $C_{10}$ | $0.153563$ | $C_{11}$ | $6.8999\times10^{-4}$ |
| $C_{12}$ | $-8.1829\times10^{-6}$ | $C_{13}$ | $1.3632\times10^{-7}$ |
| $C_{14}$ | $-6.1260\times10^{-10}$ | $C_{20}$ | $3.1260\times10^{-5}$ |
| $C_{21}$ | $-1.7111\times10^{-6}$ | $C_{22}$ | $2.5986\times10^{-8}$ |
| $C_{23}$ | $-2.5353\times10^{-10}$ | $C_{24}$ | $1.0415\times10^{-12}$ |
| $C_{30}$ | $-9.7729\times10^{-9}$ | $C_{31}$ | $3.8513\times10^{-10}$ |
| $C_{32}$ | $-2.3654\times10^{-12}$ | $A_{00}$ | $1.389$ |
| $A_{01}$ | $-1.262\times10^{-2}$ | $A_{02}$ | $7.166\times10^{-5}$ |
| $A_{03}$ | $2.008\times10^{-6}$ | $A_{04}$ | $-3.21\times10^{-8}$ |
| $A_{10}$ | $9.4742\times10^{-5}$ | $A_{11}$ | $-1.2583\times10^{-5}$ |
| $A_{12}$ | $-6.4928\times10^{-8}$ | $A_{13}$ | $1.0515\times10^{-8}$ |
| $A_{14}$ | $-2.0142\times10^{-10}$ | $A_{20}$ | $-3.9064\times10^{-7}$ |
| $A_{21}$ | $9.1061\times10^{-9}$ | $A_{22}$ | $-1.6009\times10^{-10}$ |
| $A_{23}$ | $7.994\times10^{-12}$ | $A_{30}$ | $1.100\times10^{-10}$ |
| $A_{31}$ | $6.651\times10^{-12}$ | $A_{32}$ | $-3.391\times10^{-13}$ |
| $B_{00}$ | $-1.922\times10^{-2}$ | $B_{01}$ | $-4.42\times10^{-5}$ |
| $B_{10}$ | $7.3637\times10^{-5}$ | $B_{11}$ | $1.7950\times10^{-7}$ |
| $D_{00}$ | $1.727\times10^{-3}$ | $D_{10}$ | $-7.9836\times10^{-6}$ |
The range of validity of the UNESCO equation is from
$0°\text{C}\leq T\leq 40°\text{C}$;
$0\text{ppt}\leq S\leq 40\text{ppt}$;
$0\text{bar}\leq P \leq 1000 \text{bar}\quad\approx\quad 0\text{m}\leq Z\leq 10000\text{m}$
Del Grosso's Equation
A more simple alternative to the UNESCO algorithm is the Del Grosso equation. \begin{equation} C = C_{000} + \Delta C_T + \Delta C_S + \Delta C_P + \Delta C_{STP} \end{equation} Where we can think of $C_{000}$ as being a 'base' speed of sound, with some change strictly due to temperature (in degrees Celcius): $$ \Delta C_T = C_{T1}T + C_{T2}T^2 + C_{T3}T^3 $$ some change strictly due to salinity (in parts per thousand): $$ \Delta C_S = C_{S1}S + C_{S2}S^2 $$ some change strictly due to pressure (in kg/cm2): $$ \Delta C_P = C_{P1}P + C_{P2}P^2 + C_{P3}P^3 $$ and some change due to cross terms between temperature, salinity, and pressure: \begin{multline*} \Delta C_{STP} = C_{TP}TP + C_{T3P}T^3P + C_{TP2}TP^2 + C_{T2P2}T^2P^2 + C_{TP3}TP^3+\\ C_{ST}ST + C_{ST2}ST^2 + C_{STP}STP + C_{S2TP}S^2TP + C_{S2P2}S^2P^2 \end{multline*}| $C_{000}$ | $1402.392$ | $C_{T1}$ | $0.5012285\times10^1$ |
|---|---|---|---|
| $C_{T2}$ | $-0.551184\times10^{-1}$ | $C_{T3}$ | $0.221649\times10^{-3}$ |
| $C_{S1}$ | $0.1329530\times10^{1}$ | $C_{S2}$ | $0.1288598\times10^{-3}$ |
| $C_{P1}$ | $0.1560592$ | $C_{P2}$ | $0.2449993\times10^{-4}$ |
| $C_{P3}$ | $-0.88333959\times10^{-8}$ | $C_{ST}$ | $-0.1275936\times10^{-1}$ |
| $C_{TP}$ | $0.6353509\times10^{-2}$ | $C_{T2P2}$ | $0.265617\times10^{-7}$ |
| $C_{TP2}$ | $-0.1593895\times10^{-5}$ | $C_{TP3}$ | $0.5222483\times10^{-9}$ |
| $C_{T3P}$ | $-0.4383615\times10^{-6}$ | $C_{S2P2}$ | $-0.1616745\times10^{-8}$ |
| $C_{ST2}$ | $0.9688441\times10^{-4}$ | $C_{S2TP}$ | $0.4857614\times10^{-5}$ |
| $C_{STP}$ | $-0.3406824\times10^{-3}$ |
The range of validity of Del Grosso's equation is from
$0°\text{C}\leq T\leq 30°\text{C}$;
$30\text{ppt}\leq S\leq 40\text{ppt}$;
$0\text{kg/cm}^2\leq P \leq 1000 \text{kg/cm}^2\quad\approx\quad 0\text{km}\leq Z\leq 1000\text{km}$
Every free resource I find states this range of validity for the pressure to be the same, but claims a restricted range of validity for this model (which is clearly true for salinity), but this range of depth seems almost absurd. I do not have access to the paper by Wong and Zhu (1995) to check this for myself.
Pressure to Depth
I chose to use an arguably primitive method to convert pressures to depths -- Pascal's law. $$ P = P_0 + \rho gz $$ where $P_0$ is atmospheric pressure in Pascals, $\rho$ is the density of water in kilograms per cubic meter, $g$ is acceleration due to gravity (for this case I used the average value of $g$, but this could easily be fine tuned for specific locations on earth), and $z$ is depth in meters.In an attempt to make this method slightly less archaic, I used the following equation to estimate the density of the water as a function of its temperature. $$ \rho = \frac{1000\text{kg/m}^3}{1+\beta(T-20°\text{C})} $$ where $\beta=0.0002°\text{C}^{-1}$ and $T$ is in degrees Celcius. To improve upon this, I would want the density to be a function of pressure and salinity as well.
Constant Temperature and Salinity
The first thought I had to start playing with these equations was to hold temperature and salinity constant and see the effect that only depth/pressure has on the speed of sound in the ocean. Here is the result: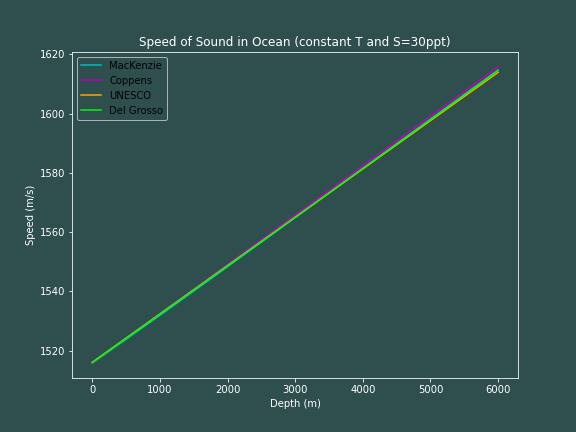
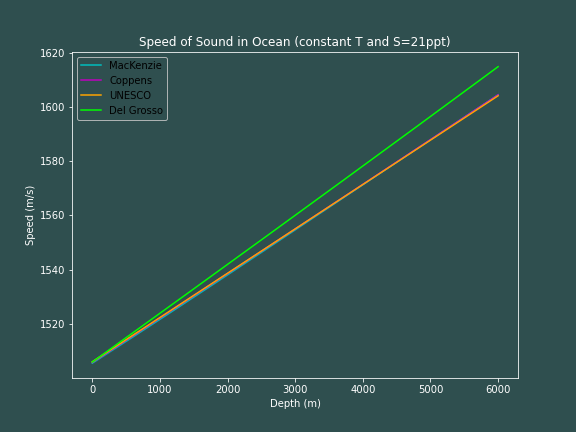
So, we see that the speed of sound changes linearly with depth when temperature and salinity is held constant (we will soon see that this is strictily due to the temperature being held constant). This makes sense after the analysis we made earlier with the MacKenzie equation, although similar analysis is much more difficult to see as the number of terms in a given equation increase -- note that all four equations agree with one another quite well.
What we also see is that if we lower the salinity to 21ppt instead of 30ppt, that Del Grosso's equation stops agreeing with the remaining three equations -- this salinity is indeed out of its claimed range of validity.
Varying Temperature
It turns out that the temperature of the ocean varies with depth in a somewhat complex way (see this example image from Wikipedia).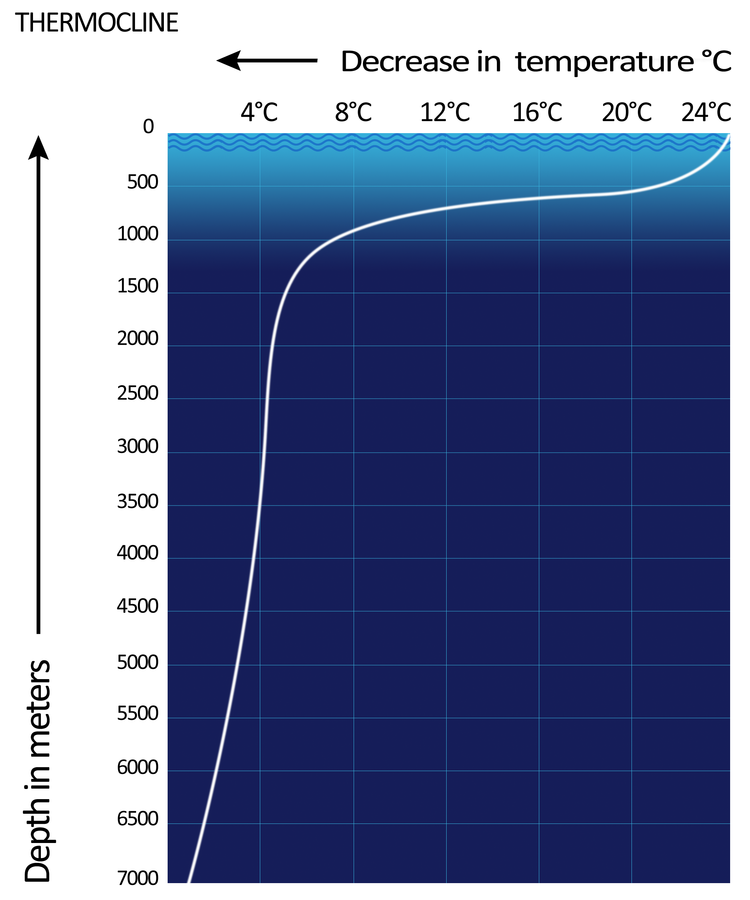
This Temperature vs. depth curve is called the Thermocline. I was unable to find an analytic function for this sort of curve from any online resources or textbooks. So my next attemp was to fit a 3rd order polynomial through 4 points that fall on this curve, but this was futile. Next I tried to fit a 9th order polynomial through 10 points, and this also had way too much variability between the points to be useful.
Finally what I ended up doing was to estimate the temperature every 100m by eyeballing the graph of the Thermocline as pictured above, and assuming that the temperature decreased linearly between each of these points. Clearly this could be improved upon by taking points more frequently, or by having an actual dataset to work with. The code below shows how I make the graphs, including the data points I used for the temperature.
import numpy as np
import matplotlib.pyplot as plt
# self-made function of thermocline
def thermocline(N):
T = []
therm_len = len(thermoline_points)
N_split = int(N/(therm_len-1))
i = 0
while i < therm_len-1:
temperature = np.linspace(thermoline_points[i][0], thermoline_points[i+1][0], N_split)
for t in temperature:
T.append(t)
i += 1
return T
# function for MacKenzie equation
def mac(t, s, z):
speed = 1448.96 + 4.59*t - 0.05304*t**2 + 0.0002374*t**3 + 0.0160*z \
+ (1.340-0.01025*t)*(s-35) + (1.675e-7)*z**2 - (7.139e-13)*t*z**3
return speed
# function for Coppens equation
def cop(t, s, z):
t /= 10 # temp divided by 10
z *= 0.001 # depth in km
c0 = 1449.05 + 45.7*t - 5.21*t**2 + 0.23*t**3 + (1.333-0.126*t+0.009*t**2)*(s-35)
speed = c0 + (16.23+0.253*t)*z + (0.213-0.1*t)*z**2 + (0.016+0.0002*(s-35))*(s-35)*t*z
return speed
# function to find density of water as function of temp
def rho_h2o(t):
beta = 0.0002
return 1000/(1+beta*(t-20))
# function for UNESCO (Chen and Millero) equation (P in bar)
def unesco(t, s, z):
# use pascal's law for primitive way to convert depth to pressure
rho = rho_h2o(t)
g = 9.80665
p0 = 101.325*0.01 # atm pressure from kPa to bar
p = p0 + (rho*g*z)*1e-5 # convert rho*g*z from Pa to bar
# define all constants
c00,c01,c02,c03,c04,c05 = 1402.388,5.03830,-5.81090e-2,3.3432e-4,-1.47797e-6,3.1419e-9
c10,c11,c12,c13,c14 = 0.153563,6.8999e-4,-8.1829e-6,1.3632e-7,-6.1260e-10
c20,c21,c22,c23,c24 = 3.1260e-5,-1.7111e-6,2.5986e-8,-2.5353e-10,1.0415e-12
c30,c31,c32 = -9.7729e-9,3.8513e-10,-2.3654e-12
a00,a01,a02,a03,a04 = 1.389,-1.262e-2,7.166e-5,2.008e-6,-3.21e-8
a10,a11,a12,a13,a14 = 9.4742e-5,-1.2583e-5,-6.4928e-8,1.0515e-8,-2.0142e-10
a20,a21,a22,a23 = -3.9064e-7,9.1061e-9,-1.6009e-10,7.994e-12
a30,a31,a32 = 1.100e-10,6.651e-12,-3.391e-13
b00,b01 = -1.922e-2,-4.42e-5
b10,b11 = 7.3637e-5,1.7950e-7
d00,d10 = 1.727e-3,-7.9836e-6
# calculate speed
d = d00 + d10*p
b = b00 + b01*t + (b10 + b11*t)*p
a = (a00 + a01*t + a02*t**2 + a03*t**3 + a04*t**4) +\
(a10 + a11*t + a12*t**2 + a13*t**3 + a14*t**4)*p +\
(a20 + a21*t + a22*t**2 + a23*t**3)*p**2 +\
(a30 + a31*t + a32*t**2)*p**3
c_w = (c00 + c01*t + c02*t**2 + c03*t**3 + c04*t**4 + c05*t**5) +\
(c10 + c11*t + c12*t**2 + c13*t**3 + c14*t**4)*p +\
(c20 + c21*t + c22*t**2 + c23*t**3 + c24*t**4)*p**2 +\
(c30 + c31*t + c32*t**2)*p**3
speed = c_w + a*s + b*s**(3/2) + d*s**2
return speed
# create a function for the Del Grosso Equation (Wong and Zhu) (P in kg/cm^2)
def del_grosso(t, s, z):
# use pascal's law for primitive way to convert depth to pressure
rho = rho_h2o(t)
g = 9.80665
p0 = 1.033 # atm pressure from kPa to kg/cm^3
p = p0 + (rho*g*z)*1.033/101325 # convert rho*g*z from Pa to kg/cm^3
# define constants
c000,cT1,cT2,cT3 = 1402.392,0.5012285e1,-0.551184e-1,0.221649e-3
cS1,cS2,cP1,cP2,cP3 = 0.1329530e1,0.1288598e-3,0.1560592,0.2449993e-4,-0.8833959e-8
cST,cTP,cT2P2,cTP2 = -0.1275936e-1,0.6353509e-2,0.2656174e-7,-0.1593895e-5
cTP3,cT3P,cS2P2,cST2 = 0.5222483e-9,-0.4383615e-6,-0.1616745e-8,0.9688441e-4
cS2TP,cSTP = 0.4857614e-5,-0.3406824e-3
# calculate speed
dcSTP = cTP*t*p + cT3P*t**3*p + cTP2*t*p**2 + cT2P2*(t*p)**2 + cTP3*t*p**3 +\
cST*s*t + cST2*s*t**2 + cSTP*s*t*p + cS2TP*s**2*t*p + cS2P2*(s*p)**2
dcP = cP1*p + cP2*p**2 + cP3*p**3
dcS = cS1*s + cS2*s**2
dcT = cT1*t + cT2*t**2 + cT3*t**3
speed = c000 + dcT + dcS + dcP + dcSTP
return speed
# set some constant value for salinity, and note how many steps we want
s = 21
N = 6000
# Create an array of points that fall on the thermoline (estimate) to generate linear
# temperatures between (every 100m of depth)
thermoline_points = [(24,0),(23.8,100),(23.5,200),(23,300),(22,400),(21,500),\
(17.5,600),(13,700),(9.8,800),(8.2,900),(7,1000),\
(6.5,1100),(6,1200),(5.5,1300),(5.25,1400),(5,1500),\
(4.9,1600),(4.8,1700),(4.7,1800),(4.6,1900),(4.5,2000),\
(4.47,2100),(4.44,2200),(4.41,2300),(4.38,2400),(4.35,2500),\
(4.32,2600),(4.29,2700),(4.26,2800),(4.23,2900),(4.2,3000),\
(4.17,3100),(4.14,3200),(4.10,3300),(4.06,3400),(4.0,3500),\
(3.93,3600),(3.85,3700),(3.78,3800),(3.7,3900),(3.63,4000),\
(3.55,4100),(3.48,4200),(3.4,4300),(3.33,4400),(3.25,4500),\
(3.17,4600),(3.09,4700),(3.0,4800),(2.92,4900),(2.84,5000),\
(2.76,5100),(2.68,5200),(2.6,5300),(2.52,5400),(2.44,5500),\
(2.36,5600),(2.28,5700),(2.2,5800),(2.1,5900),(2.0,6000)]
# range of depth
depth = np.linspace(0,6000,N)
# temps at some depth
temps = thermocline(N)
# get speeds as function of depth and temp
mac_constS_speed = []
cop_constS_speed = []
unesco_constS_speed = []
del_grosso_constS_speed = []
i = 0
while i len(depth):
mac_constS_speed.append(mac(temps[i], s, depth[i]))
cop_constS_speed.append(cop(temps[i], s, depth[i]))
unesco_constS_speed.append(unesco(temps[i], s, depth[i]))
del_grosso_constS_speed.append(del_grosso(temps[i], s, depth[i]))
i += 1
with plt.rc_context({'axes.edgecolor':'white','xtick.color':'white','ytick.color':'white',\
'figure.facecolor':'darkslategrey','axes.facecolor':'darkslategrey',\
'axes.labelcolor':'white','axes.titlecolor':'white'}):
fig = plt.figure(figsize=(8,6))
ax = plt.subplot(111)
ax.plot(depth, mac_constS_speed, 'c', label="MacKenzie")
ax.plot(depth, cop_constS_speed, 'm', label="Coppens")
ax.plot(depth, unesco_constS_speed, color="orange", label="UNESCO")
ax.plot(depth, del_grosso_constS_speed, color="lime", label="Del Grosso")
ax.legend()
ax.set_title("Speed of Sound in Ocean (constant T)")
plt.savefig("../images/speed_var_T.png")
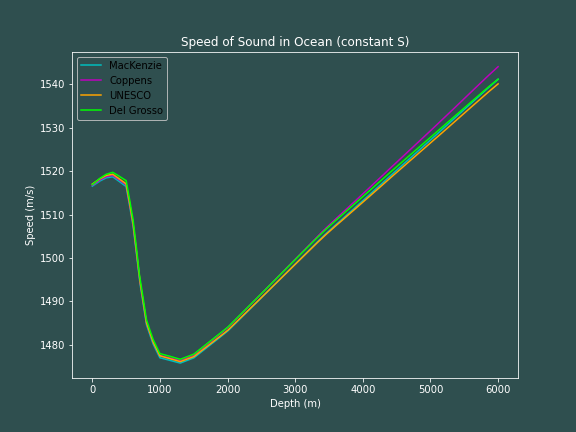
Again, we see that all of the equations agree with one another quite well, with the Coppens equation varying once it goes beyond a depth of 4000m.
We see that ther is a minumum at around 1200m. This is actually a fascinating result, and we call this region of minimum speed the sound channel. Sound traveling along this channel is able to travel very far distances (sometimes halfway around the entire globe). This happens due to refraction -- due to the increase in speed, sound rays pointing upward at a small enough angle are able to bend back downward toward the channel, and rays pointing downward at a small enough angle are able to bend back upward toward the channel.
This is a good page to gain a little more intuition about the refraction of sound waves.
The depth of the sound channel obviously depends on water conditions, but is most generally determined by geographic regions; tending to be near the surface (as close as 10m below sea level) at high latitudes.
Varying Salinity
The next obvious step is to see how changes in salinty affect the speed of sound in the ocean. The following code block shows how I made 3D heat maps showing the speed of sound as a function of depth, salinity, and temperature.
# importing mplot3d toolkits
from mpl_toolkits import mplot3d
from pylab import *
# defining axes
salinity = np.linspace(0,40,N)
# get speeds as function of depth
mac_varS_speed = []
cop_varS_speed = []
unesco_varS_speed = []
del_grosso_varS_speed = []
salinity_3D = []
depth_3D = []
temp_3D = []
for s in salinity:
i = 0
while i len(depth):
salinity_3D.append(s)
depth_3D.append(depth[i])
temp_3D.append(temps[i])
mac_varS_speed.append(mac(temps[i], s, depth[i]))
cop_varS_speed.append(cop(temps[i], s, depth[i]))
unesco_varS_speed.append(unesco(temps[i], s, depth[i]))
del_grosso_varS_speed.append(del_grosso(temps[i], s, depth[i]))
i += 1
with plt.rc_context({'axes.edgecolor':'white','xtick.color':'white','ytick.color':'white',\
'figure.facecolor':'darkslategrey','axes.facecolor':'darkslategrey',\
'axes.labelcolor':'white','axes.titlecolor':'white'}):
fig = plt.figure(figsize=(12,12))
# syntax for 3-D projection
ax = plt.axes(projection ='3d')
scat_plot = ax.scatter(salinity_3D, del_grosso_varS_speed, depth_3D, c=temp_3D, cmap="cool")
color_map = plt.get_cmap('cool')
cbar = plt.colorbar(scat_plot)
cbar.set_label("Temperature (C)", fontsize=20)
ax.set_title('Del Grosso Equation', fontsize=24)
ax.set_xlabel("Salinity (ppt)", fontsize=20)
ax.set_ylabel("Speed (m/s)", fontsize=20)
ax.set_zlabel("Depth (m)", fontsize=20)
# syntax for plotting
ax.view_init(185, 205)
plt.savefig('../images/delGrosso_image.png')
plt.show()
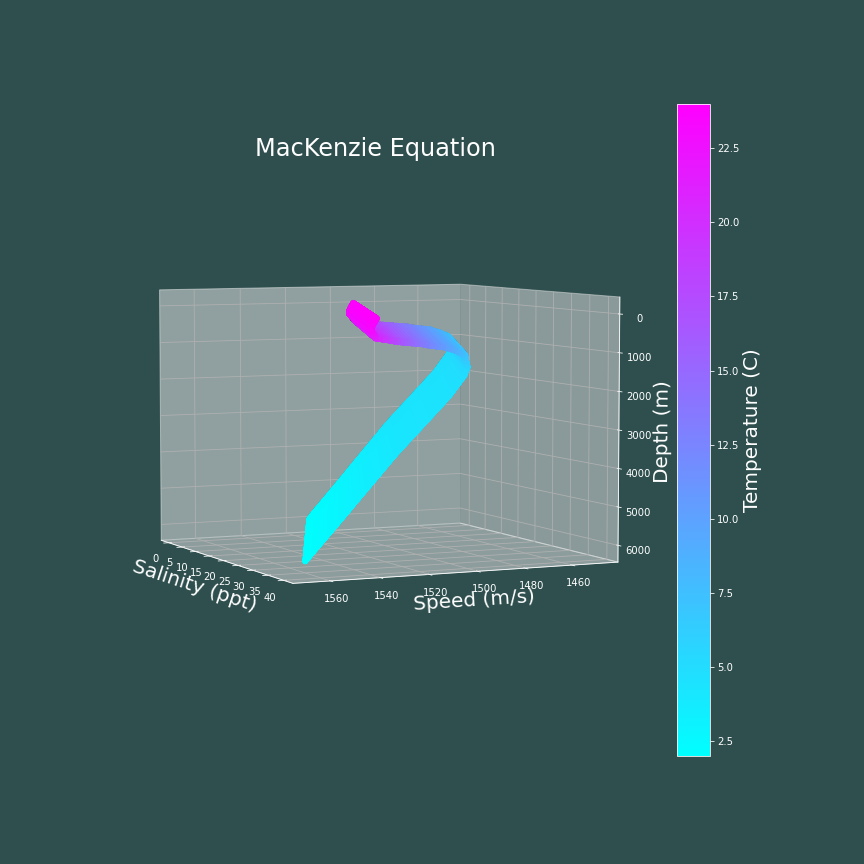
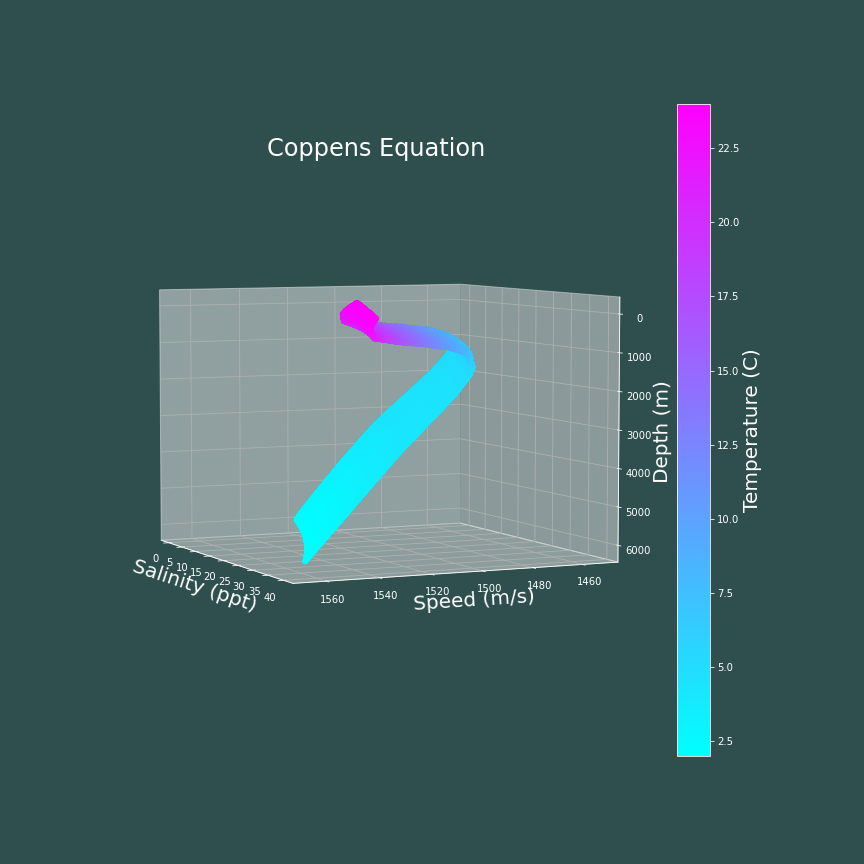
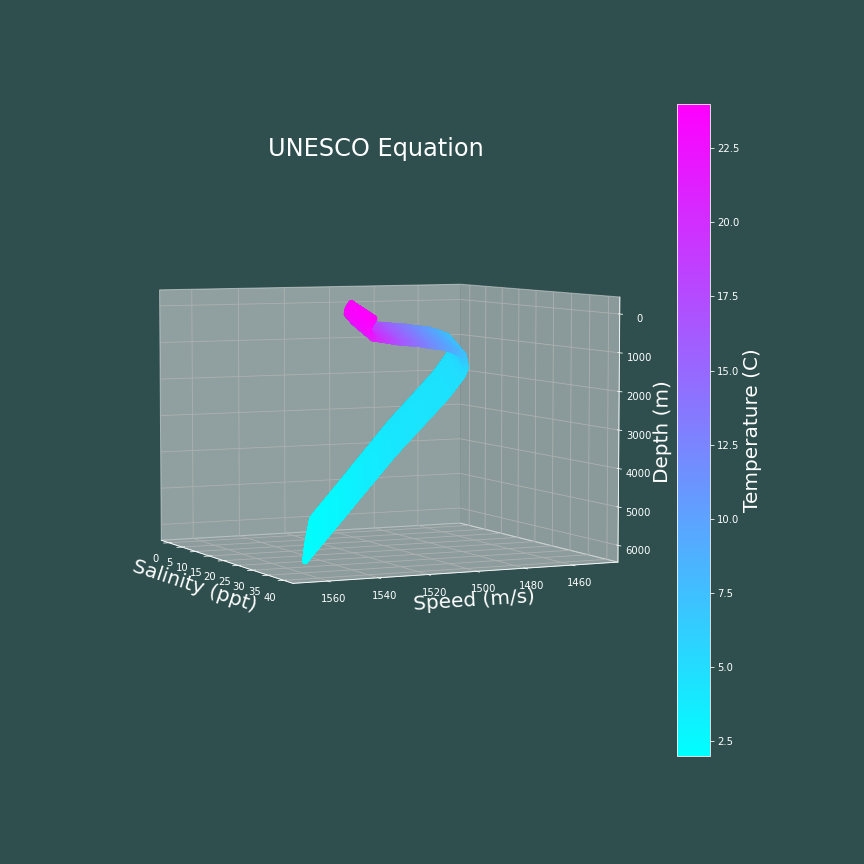
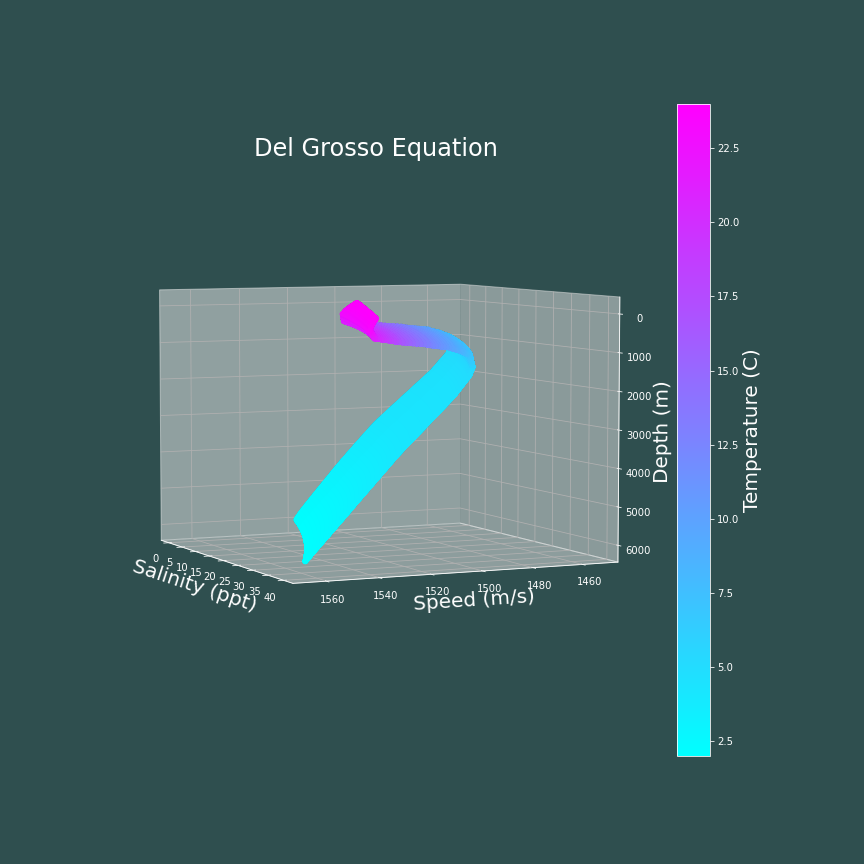
The main take away from these plots is that the speed of sound in water tends to increase with salinity. In this case, the MacKenzie equation and the UNESCO equation appear to increase linearly with salinity, and look almost identical. The Coppens equation and Del Grosso's equation appear to increase with salinity in a nonlinear fashion, and also look very similar to one another.
Finally, I made an animation of the MacKenzie equation plot rotating about 360 degrees.
from matplotlib.animation import FuncAnimation
with plt.rc_context({'axes.edgecolor':'white','xtick.color':'white','ytick.color':'white',\
'figure.facecolor':'darkslategrey','axes.facecolor':'darkslategrey',\
'axes.labelcolor':'white','axes.titlecolor':'white'}):
fig = plt.figure(figsize=(12,12))
ax = plt.axes(projection ='3d')
color_map = cm.ScalarMappable(cmap="cool")
color_map.set_array(temp_3D)
cbar = plt.colorbar(color_map)
cbar.set_label("Temperature (C)", fontsize=20)
ax.set_title('MacKenzie Equation', fontsize=24)
ax.set_xlabel("Salinity (ppt)", fontsize=20)
ax.set_ylabel("Speed (m/s)", fontsize=20)
ax.set_zlabel("Depth (m)", fontsize=20)
ax.scatter(salinity_3D, mac_varS_speed, depth_3D, c=temp_3D, cmap="cool")
def update(i, fig, ax):
ax.view_init(elev=-185, azim=i)
return fig, ax
anim = FuncAnimation(fig, update, frames=np.arange(0, 360, 0.3), repeat=True, fargs=(fig, ax))
anim.save('../images/mackenzie.mp4', dpi=80, writer='ffmpeg', fps=40)